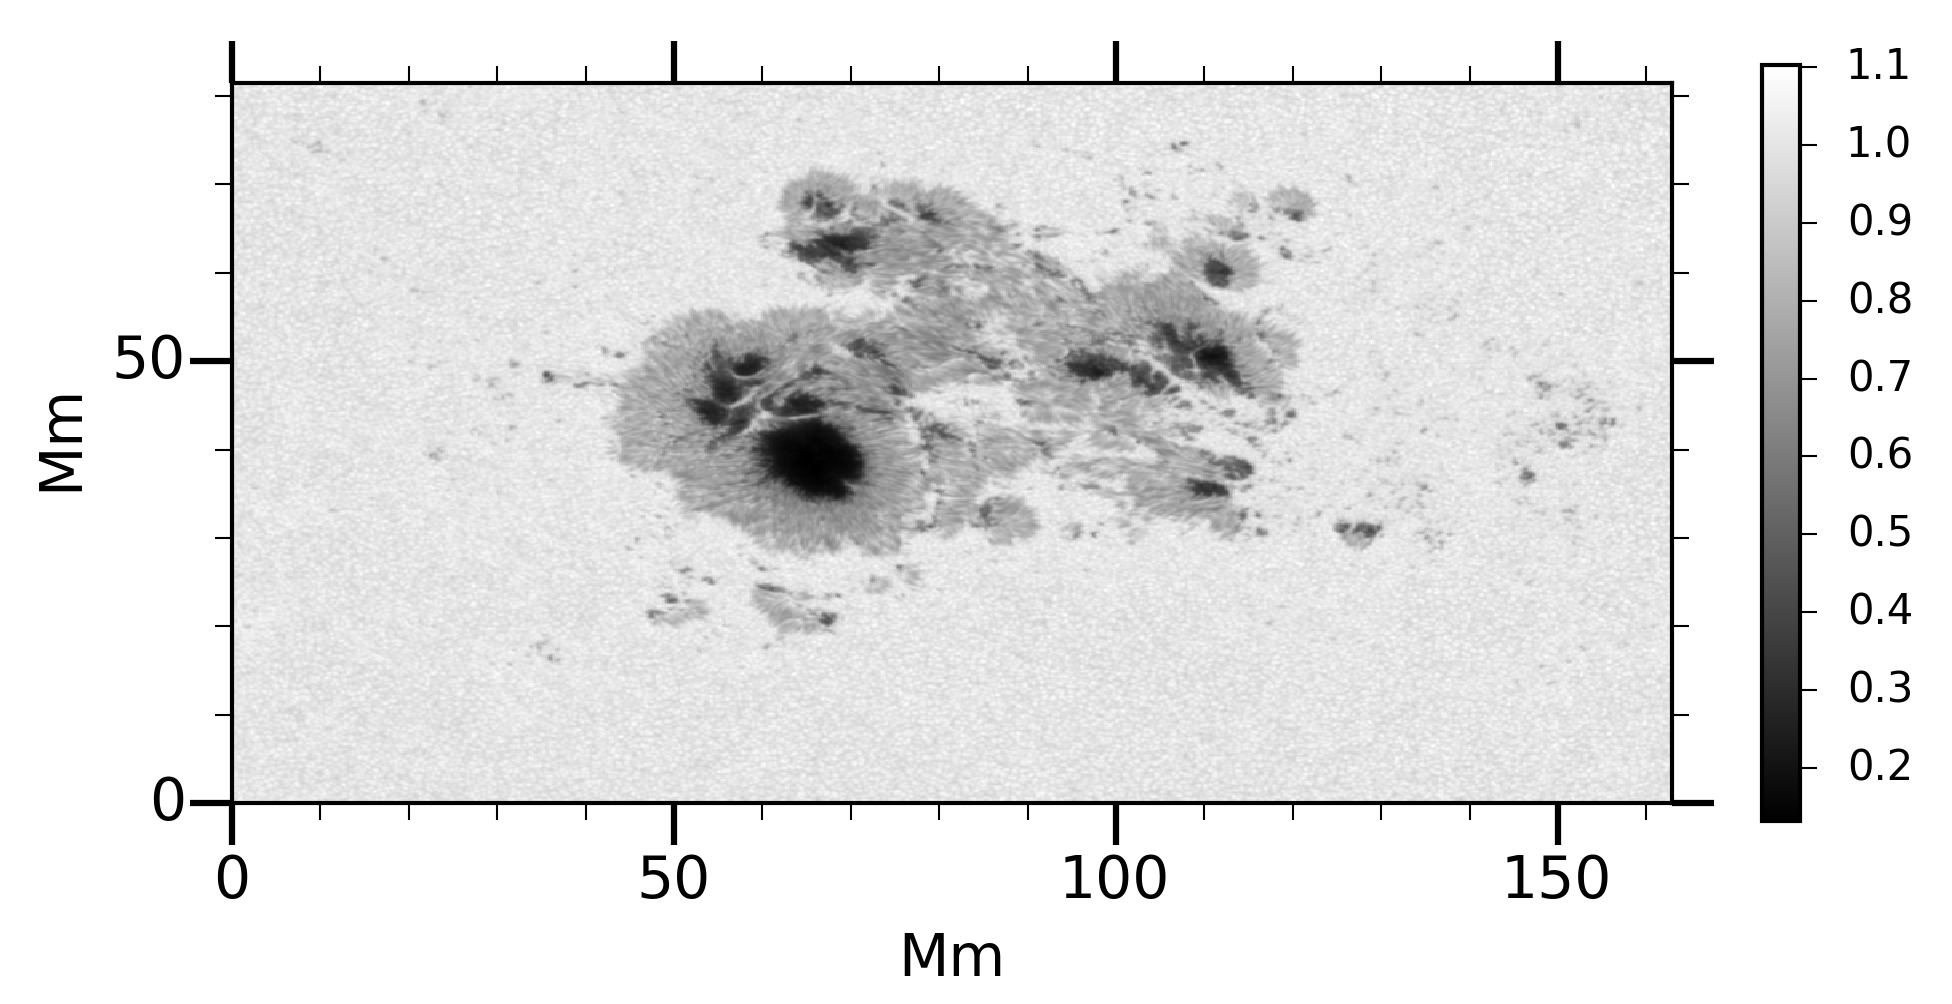
 Continuum image of HMI Fabry-Perot instrument
Continuum image of HMI Fabry-Perot instrument
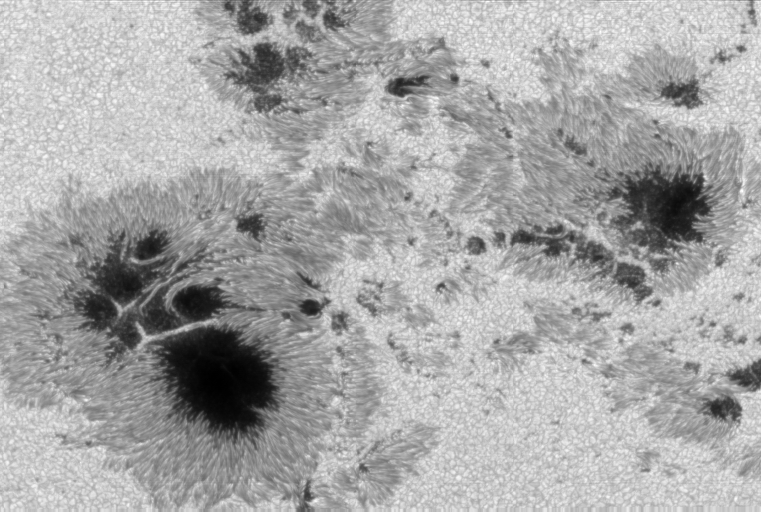 630 nm continuum map of Hinode spectropolarimeter
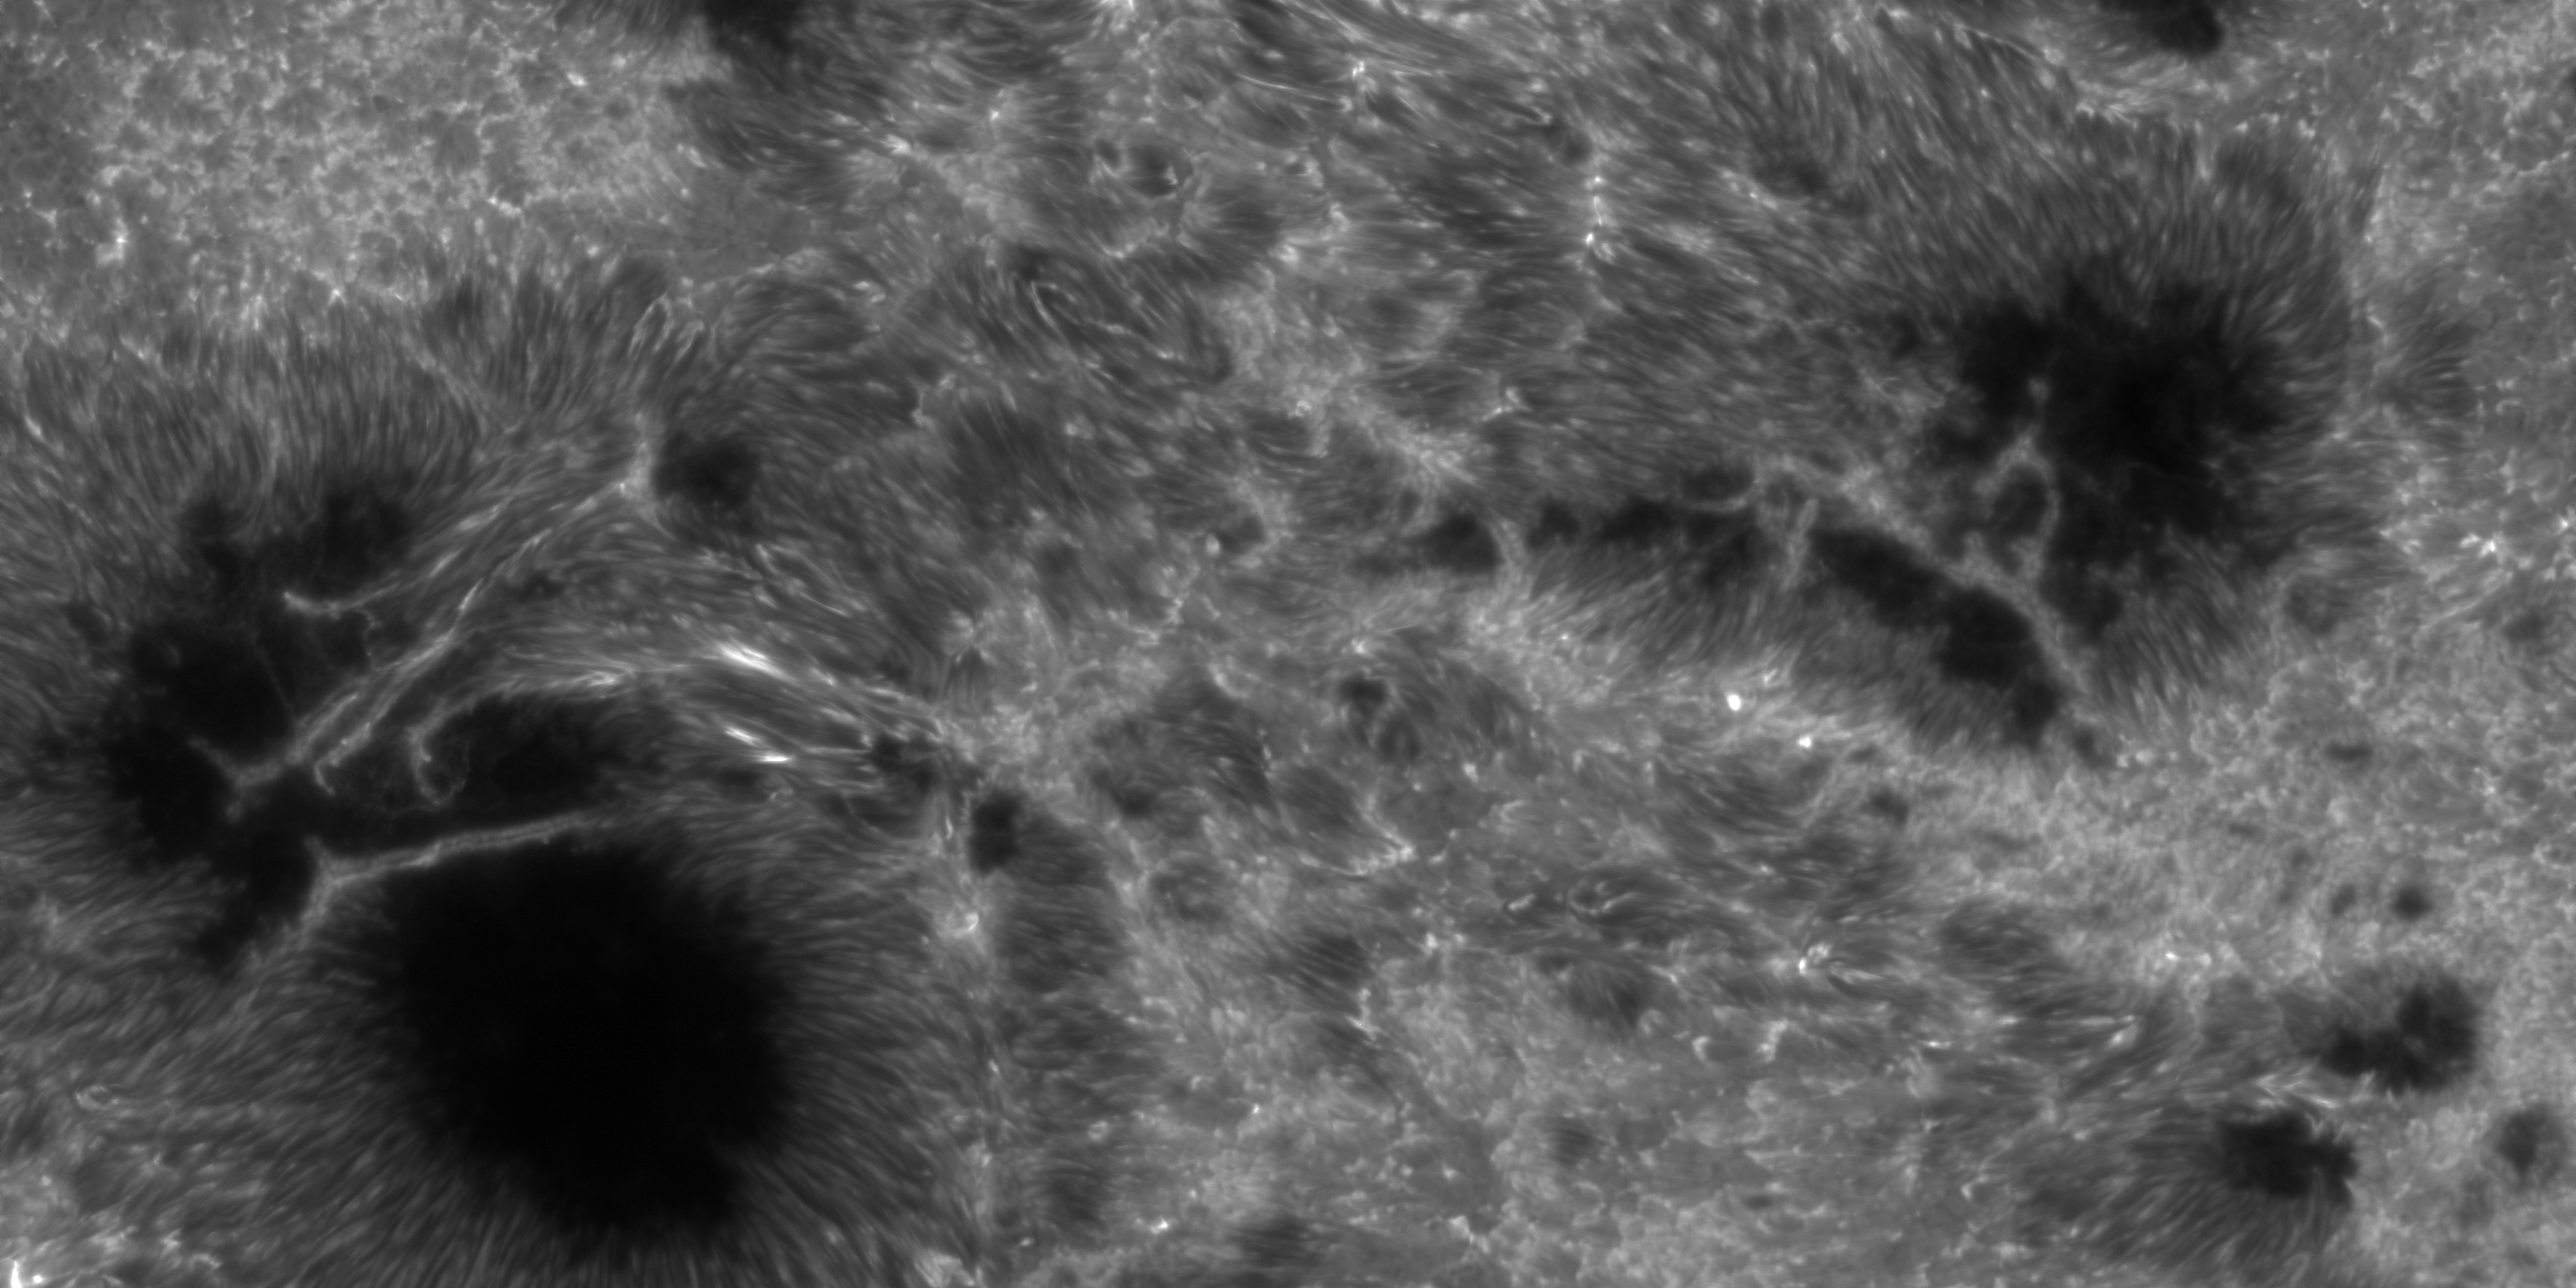 Ca II H filtergram of Hinode
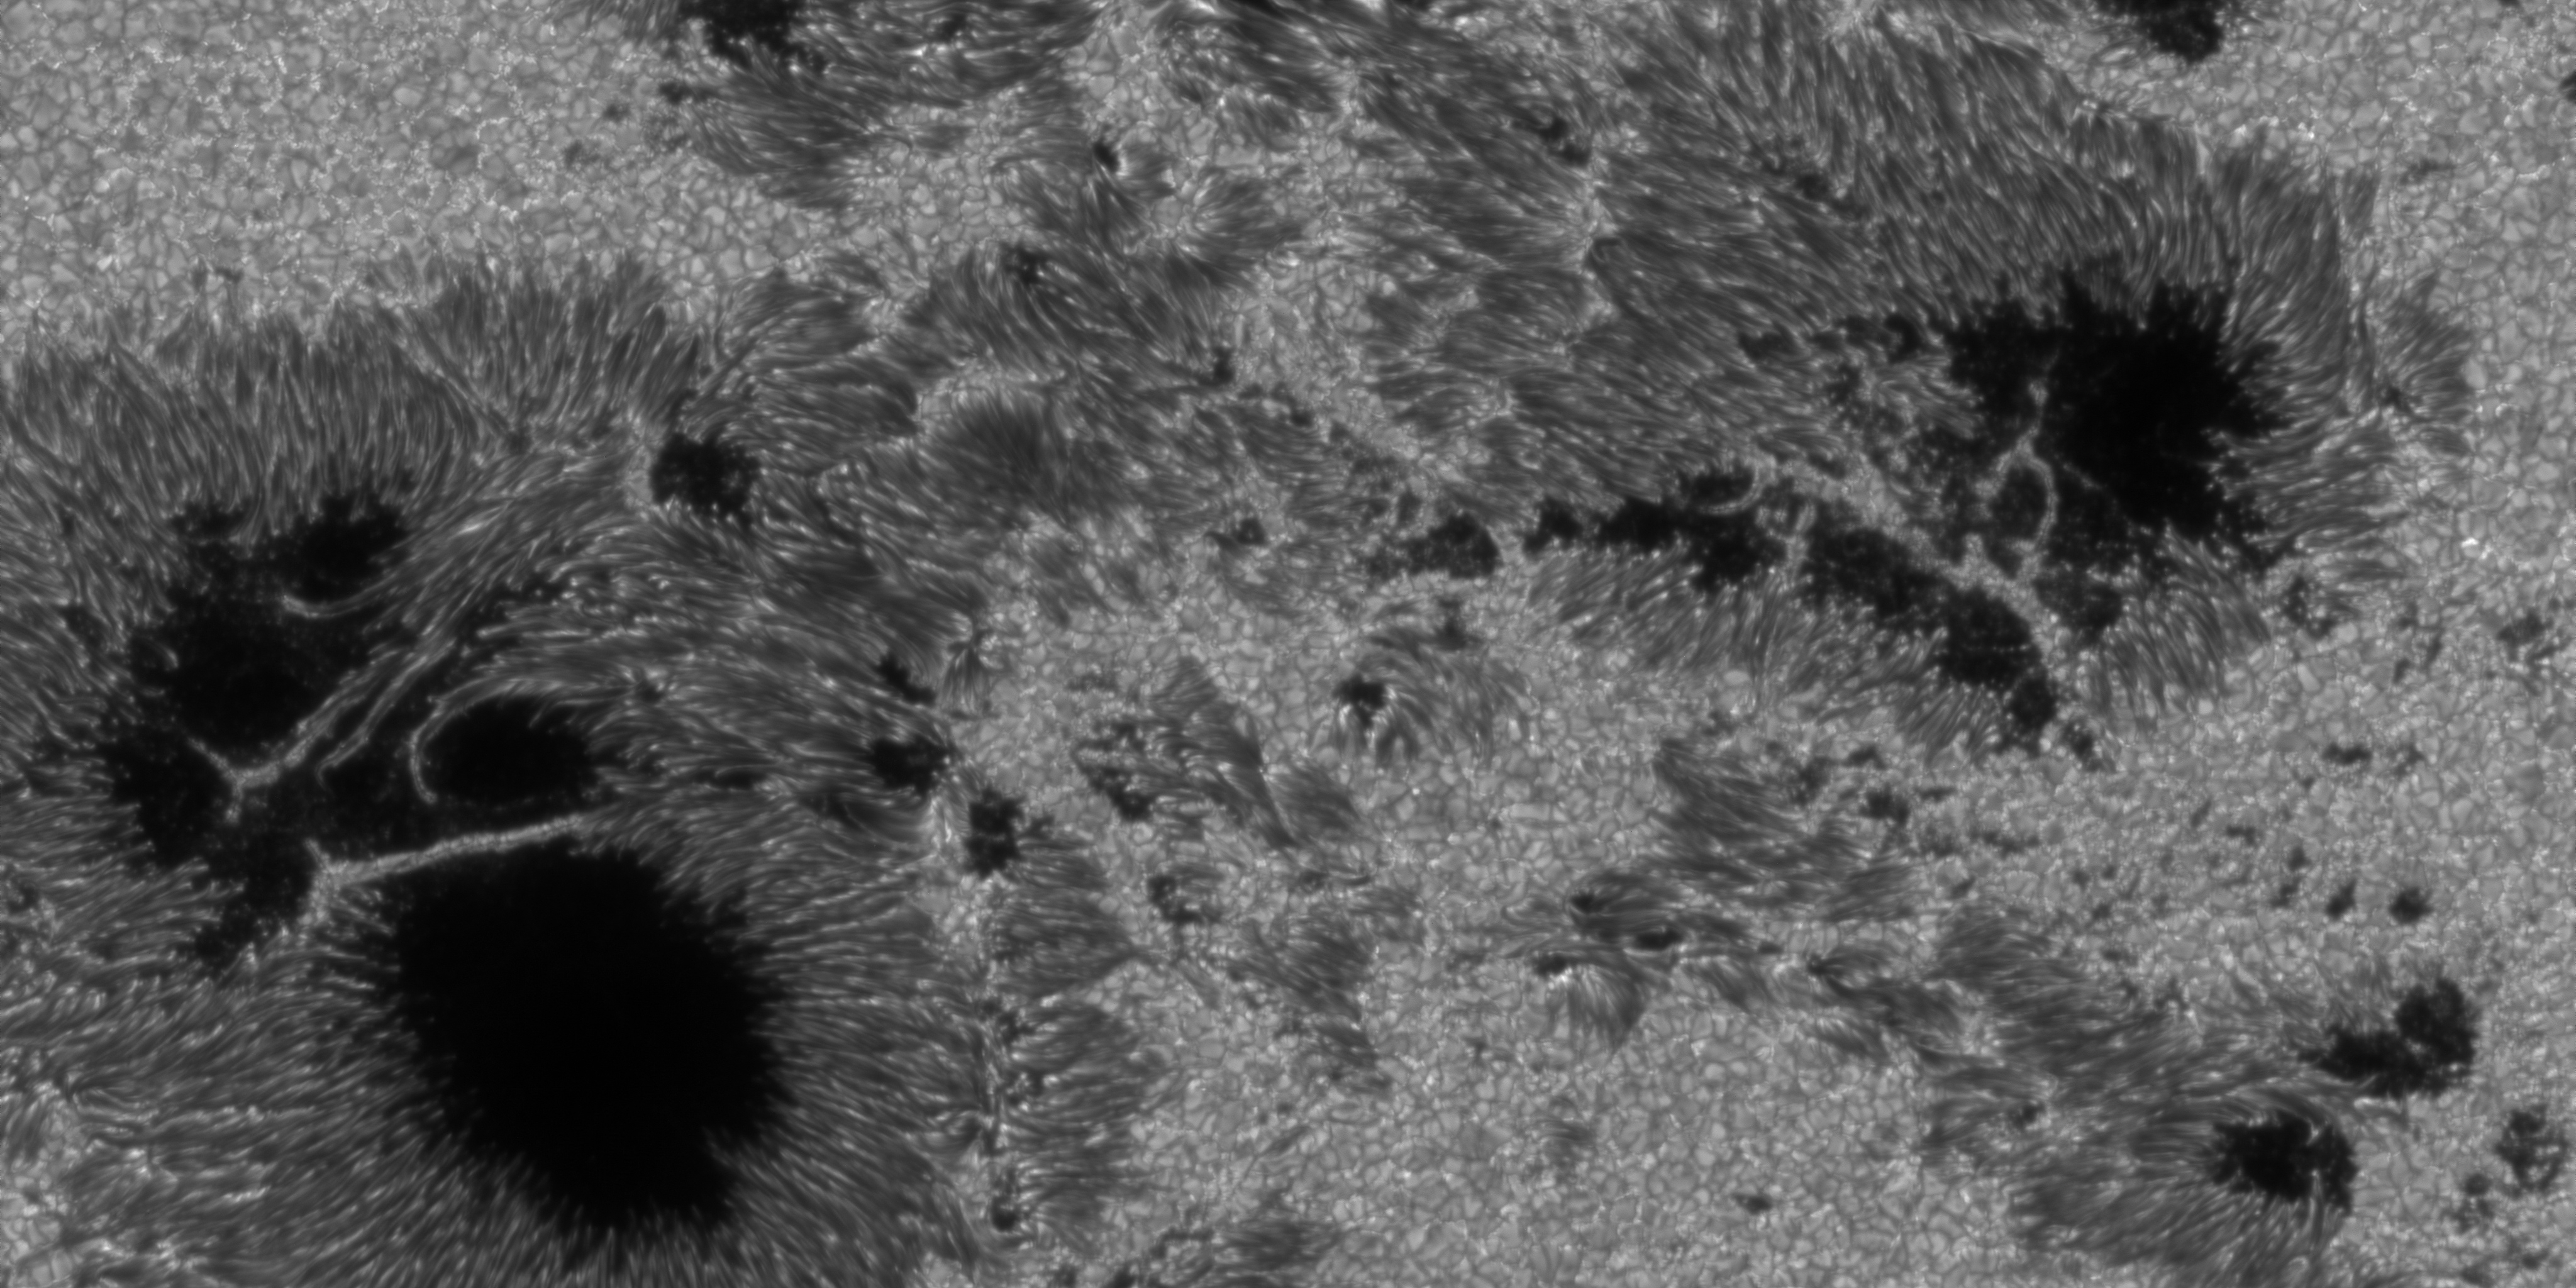 G-band filtergram of Hinode
The continuum maps of HMI and Hinode are similar except that the Hinode data has a higher spatial resolution. The G-band image shows the same photospheric structure with an enhanced contrast. It consists of temperature sensitive molecular bands and first was named so by Fraunhofer. The Ca II H image shows a mixture of the photosphere and chromosphere. Structures have a slightly different morphology in these maps.